How to track computer temperature? Top programs
A working computer is always hot, and a powerful computer heats up twice as fast. Find out the exact temperature is easy with the help of special programs. However, what is this measurement for?

Contents
Why do I need an application for testing and diagnosing hardware on a computer?
They measure not the temperature of the computer, but its individual nodes. For this, the central processing unit (CPU), the video card, the hard disk, and the motherboard are almost always equipped with thermal sensors – thermometers. This was done because each component has its own range of operating temperatures. Most video cards will withstand up to 90 ° C, and the CPU – 105 ° C. To answer the question: “And what is the processor temperature considered normal for a computer?”, It is best to go to the manufacturer’s website and find recommendations for a particular model. You need to focus on the criterion “T junction”. Sometimes they use more understandable – “Maximum temperature”. It is very unlikely that the CPU will heat up to the highest permissible level – the automation will first turn off the power supply. Why know the temperature, if the computer itself is not smoking? There are 2 reasons for this:
- To reduce the wear of components . The higher the power consumption, the more intense the heating. This changes the electrical resistance – a separate transistor will not work in the calculated conditions. If, after the measurement, the rate of the equipment manufacturer is not exceeded, then there is no need to improve cooling.
- To find out the overclocking potential . A computer device is created with a margin of safety. That is, it can warm slightly, which allows you to “stretch” 10-20% of additional performance. During such acceleration, it is important to know how much more energy can be increased in the component, which directly affects heating.
It is necessary to measure at maximum PC load in order to:
- The user was confident that the system would work stably even in summer heat, and for 15 hours in a row.
- Overloker understood how much you can increase system performance.
Utilities for testing a computer create so many requests that their processing requires all its computational power. Otherwise, monitoring applications are used. Whatever the temperature of the computer, the program will simply display the current value, but it will not load any third-party system.
Universal programs
Most often used for the processor and video card – the components most often overheated.
It is important to comply with the conditions:
- run 15-20 minutes after turning on the computer;
- there must be drivers on the equipment – otherwise the application will not “see” the thermal sensor;
- do not focus on one device – that the processor is cool, then the motherboard is dead.
Sometimes programs fail. For example, how to find out the temperature of the computer’s power supply if it is not equipped with a thermal sensor? Without an external meter this is not possible. Most power supplies by default are not equipped with a thermal sensor.
We diagnose overheating with AIDA
AIDA64 is paid, but you can download a free 30-day version. It is incomplete, but what is available is enough to determine the temperature. Convenient interface – data on the current temperature conditions are collected in one place.
To do this:
- Make sure that the “Menu” tab is selected in the left pane, and not the “Favorites”.
- Click on the 1st line “Computer”.
- In the drop-down menu, select “Sensors”.
- Look at the figures in the right pane.
Hereinafter, the conventional decoding of individual thermal sensors is used:
- “Motherboard” – the temperature of the motherboard. If more than 50 ° C, then you need to reduce. For cooling, install additional fans in the system unit (desktop) or use ventilating pads (laptop).
- “CPU” or “CPU Package” – the central processor. There may be several lines: “CPU 1 Core 1”, “CPU 1 Core 2”, “CPU IA Cores”. Just look at the “CPU” or “CPU Package” – the differences in the testimony are minimal. Under high load temperatures can reach 80 ° C, but worse if such values are observed in idle mode.
- “Diode GP” – the temperature of the video card. As with the processor, there may be several lines: “DioGP (DisplO)”, “DioGP (MemlO)”. The differences are minimal – just look at the first value, to correctly check the temperature of the video card, you need to load it with something resource-intensive. For example, turn on the game with the highest quality graphics. Regarding the temperature – 80 ° C and above require additional cooling. However, one should take into account the stability of holding the maximum temperature and the temperature mode recommended by the device manufacturer.
- There is no common abbreviation for hard drives in the utility. In AIDA64, the corresponding temperature sensor will be named the same as the drive itself. That is, it could be a Hitachi HDSC72010 – a conditional example. Usually the disk temperature is the lowest among all the equipment. It can easily be 30-35 ° C. It is worth being wary when the value of 55 ° C is exceeded. This issue will be discussed in more detail in the last section of the article.
Speccy
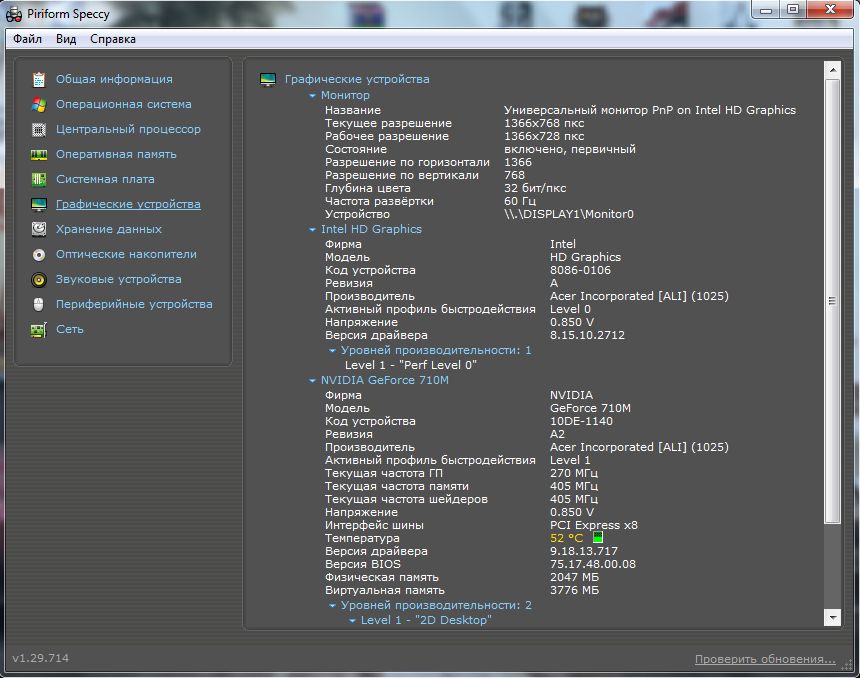
An information utility that can be used to control temperature. There is a paid and free version – the functions of the latter are enough to check which components are overheating. To do this, after downloading and installing the following:
- look at the right pane of the initial window – displays data about the main components;
- if you need to investigate the temperature mode of a specific device – click on its line in the left pane, for example, for a video card it will be “Graphic devices”;
- detailed information will be displayed – for example, the temperature of each core will be displayed for a multi-core processor.
The program is simple, but at the same time it has an advanced function of exporting the data to a text or XML document.
CPU temperature information in CPUID HWMonitor
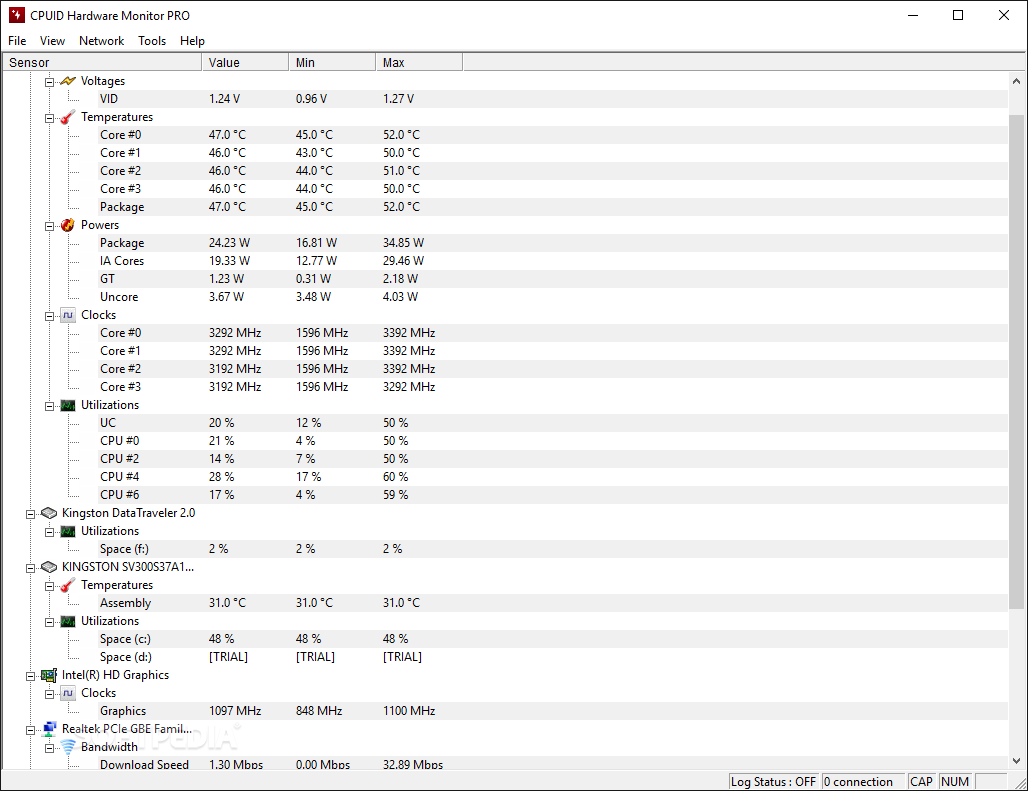
To find out the CPU temperature, after downloading and installing the program, the following is performed:
- find where the data on the processor is located – on the initial window all lines are opened, and you need to look at the one that starts with AMD or Intel;
- the utility displays the temperature for each core – always adjacent lines;
- in any row in HWMonitor there are 3 columns with values: current (Value), maximum (Max) and minimum (Min);
- pay attention to the maximum CPU temperature recorded by HWMonitor.
So that you can always see information about the current temperature in the system tray (lower right corner), you need to buy the application.
HWMonitor utility interface
The program resembles the standard “Device Manager” Windows. The difference is that more information is provided. So that unnecessary lines do not interfere, click on them one by one – they will collapse.
You need to be careful – the program displays values not only in degrees Celsius, but also in Fahrenheit.
Processors
The temperature of the CPU which should be on the computer is an ambiguous statement. Summarizing – the colder, the more reliable and higher the potential for overclocking. If you do not need to overclock the PC so that it pulls the last toy, then a temperature of 60-70 ° C will be a normal value.
Core temp
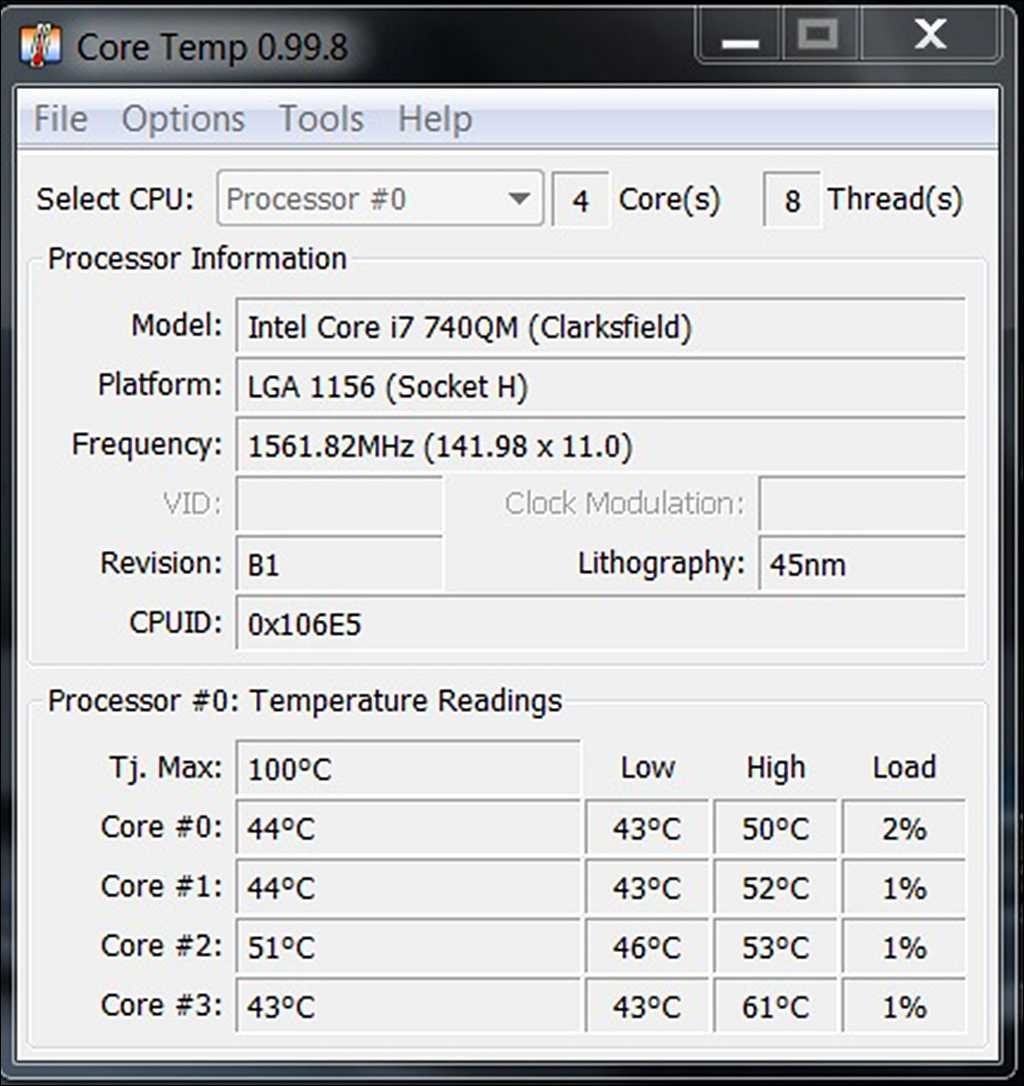
The most suitable solution if you are interested in the temperature mode of the processor only. After downloading and installation, icons will appear in the tray indicating the temperature for each core. A right-click on one of them will bring up the main utility window. There you can track the dynamics of temperature changes – the largest and smallest value is displayed during the program operation.
Find out the temperature of the processor using the command line
This is convenient if you need to check the heat once and not bother with installing third-party applications. First you need to run the command line: hold down the key combination Win + R, type cmd, press Enter. A black window will open where to copy:
- wmic / namespace: \\ root \ wmi PATH MSAcpi_ThermalZoneTemperature get CurrentTemperature
Run the query by pressing Enter – the current temperature in Kelvin degrees, multiplied by ten, is displayed. No need to take into account the last figure, you need to subtract 273 from this number (three-digit).
You can still use PowerShell. To do this, hold Win + R, enter powershell, run the utility by pressing Enter. Copy to the appeared window:
- get-wmiobject msacpi_thermalzonetemperature -namespace “root / wmi”
A lot of system data will be displayed, but the “CurrentTemperature” line is needed – it will have the temperature in Kelvin.
How to lower the temperature of the processor on the computer if it is too high? There are 2 key ways:
- Improve cooling. Put a more powerful cooler, increase the fan speed on the existing one, clean the internal space of the system unit.
- Make sure the software is in good condition on the PC. Often, incorrect application settings cause full CPU utilization even at rest, such things are characteristic even in the presence of viruses.
Video Cards
If you need to get maximum information about the video adapter, then you should use the following utilities. But it is necessary to take into account that quite often there are 2 adapters in the system: integrated (soldered to the motherboard or combined with the processor) and discrete (separately connected). Overheating problems are typical for discrete ones – they are more productive. The critical level for each device is individual and is listed on the manufacturer’s website. For example, for nVidia GeForce GTX 980 Ti – 92 ° C.
FurMark to assess video performance and stability
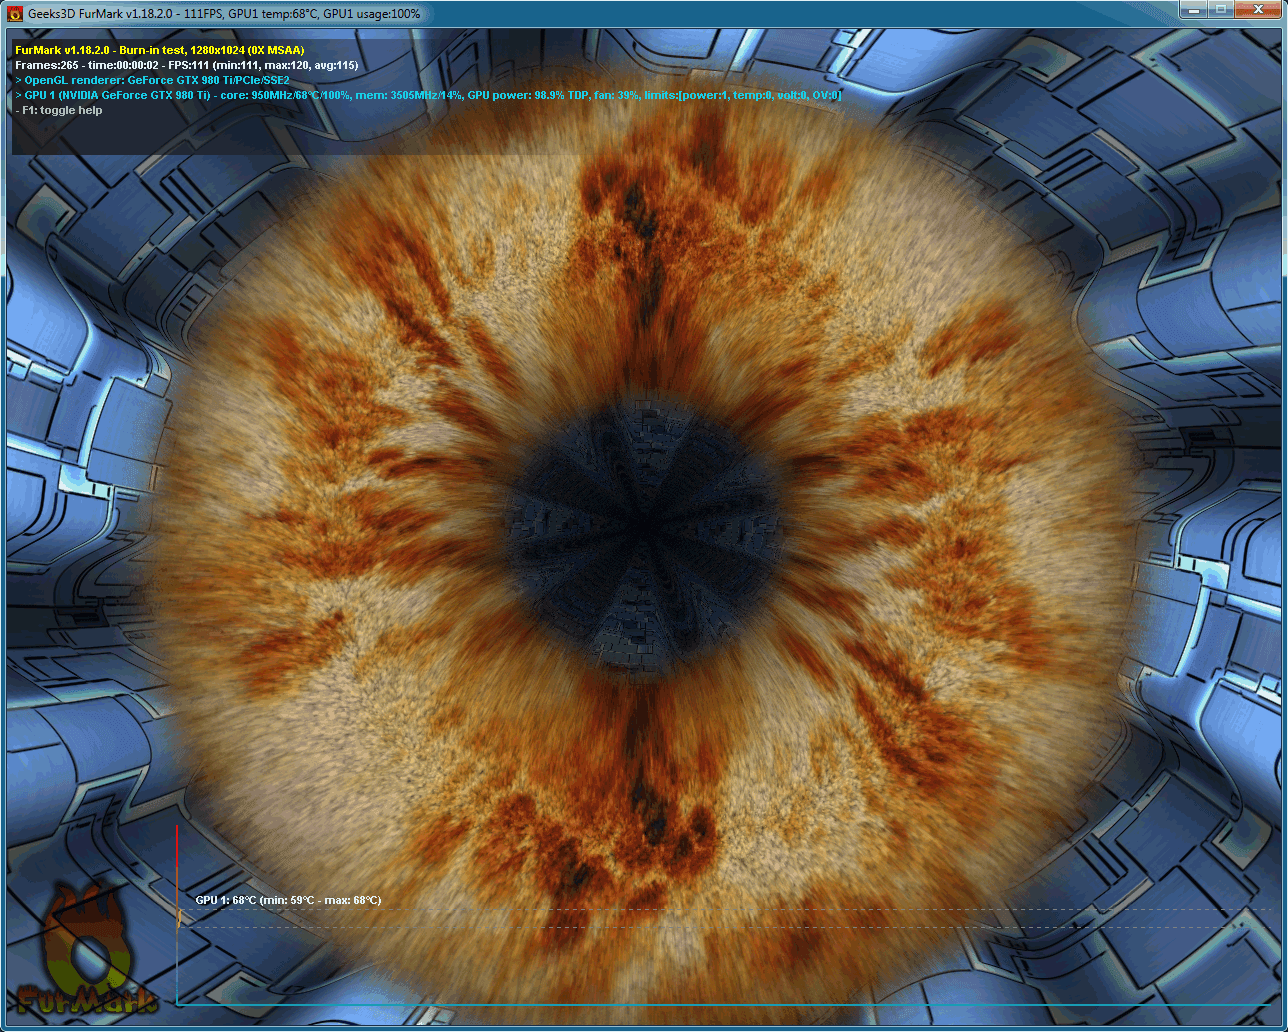
The program is more intended for stress testing of the graphics system. It creates maximum loads and analyzes what kind of weakness in the video card. After downloading , installing and running, a window will immediately appear. Under the colorful logo you need to find the line GPU, at the end it will show the current temperature. It is recommended to start crash testing after that – just press the “GPU Stress Test” button. If the PC does not reboot during the test, the video card does not overheat for sure.
FurMark also includes GPU-Z, a utility for getting information about a video card. To start it, click on the button GPU-Z. It can also be downloaded and installed separately . To find out the temperature using this utility, perform the following after launch:
- go to the Sensors tab at the top of the window – this is the second tab;
- find the line GPU Temperature.
The utility is convenient because it displays the temperature change on the graph. This is convenient if you are interested in the capabilities of the computer after a long game. It is immediately clear how the cooling system copes with the load.
For disk (HDD, SSD)
Overheating is more inherent in HDD, not SSD. In the classic hard disk placed magnetic disks that rotate electric motor – the main heat comes from him. In the SSD, nothing warms up, and usually such disks work normally up to 70 ° C, and if this value is exceeded, some options are simply disabled. Therefore, it is worth exploring the temperature regime only for HDD under the following conditions:
- put on copying or downloading from the network a large amount of information (at least 10 GB);
- do not include third-party applications – let the system be occupied only with data recording;
- the main thing is that the disk worked intensively for at least 15 minutes.
After such a run, the disc warms up well, and the results obtained will be useful, not just informational.
It is important that for HDD and SSD temperature conditions – not the main factor of wear. To examine the state of the drive, SMART attributes are first evaluated using special utilities (HDDScan or CrystalDiskInfo).
HDD Temperature
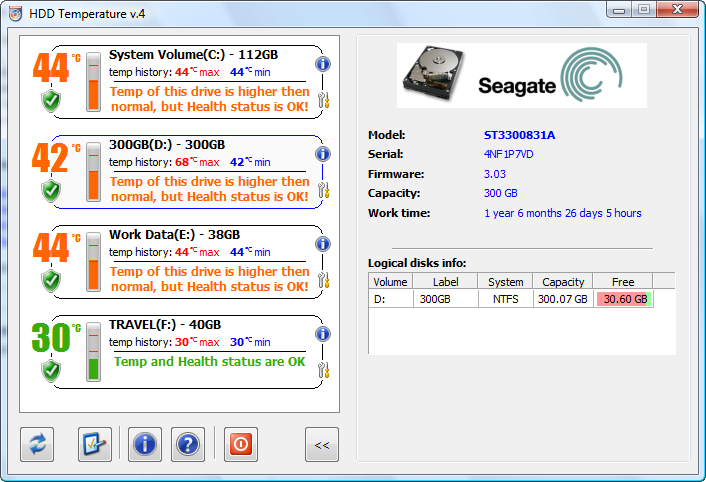
After downloading and installing this application, you can instantly find out the temperature of the disks. However, compatibility problems may arise as HDD Temperature has not been updated for a long time. Regarding the functionality of the utility – it is elementary, it just can not get confused.